
Do you live in one of the safest or most dangerous places to work in Great Britain? From fatal to non-fatal injuries, the accident at work claims team at Express Solicitors has looked across the UK to find out. Based on data from the Health and Safety Executive we’ll tell you exactly how safe or unsafe your city is.
Plus, we explore whether the North or South of Great Britain is safer, and the effects of the Coronavirus pandemic on personal injury claims in the workplace. So, to find out where your city falls, read on.
Quick overview:
- Workplace deaths are the highest in England they have been in the last five years, despite lockdowns and the furlough scheme leading to less working on-site
- Working from home reduced reported workplace accidents by up to 20%, primarily due to lockdowns.
- The South West of England saw the highest amount of workplace deaths, which was the highest it has recorded in the last five years. The North East saw the lowest.
- East Yorkshire is the least safe county to work in. With 464 accidents per 100,000 employees, you had a 0.46% chance of a non-fatal injury last year.
- Other locations with the most non-fatal injuries were West Midlands, Manchester, West & South Yorkshire, Merseyside, Kent, Lancashire and Essex.
- London is the safest place to work in Great Britain. Whilst it had the highest number of accidents, with 5,065 non-fatal injuries, potentially worth over £55million in claims, these accidents are low when averaged across the entire population.
- After London, it was Reading, Windsor and Maidenhead, Brighton and Hove, Bristol, Southampton, York, and Portsmouth that had the lowest amount of reported non-fatal injuries per 100,000 employees.
During lockdowns accidents were lower than ever
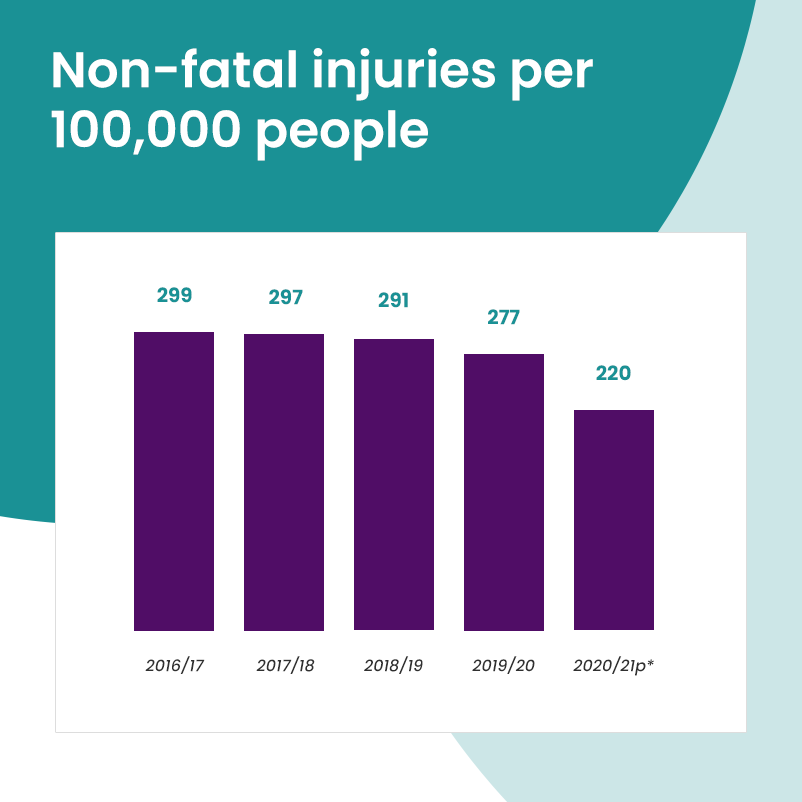
Since 2016, accidents at work have been declining year-on-year, with a drastic fall of 20% from 2019/20 to 2020/21. This trend is unsurprising with such high numbers of employees on furlough and working from home.
The HSE’s technical report on The Impact of the coronavirus pandemic on the interpretation of Health and Safety Statistics 2020/21 supports this, indicating that “This pattern of falls is largely in line with when and where the restrictions fell.” Outside of lockdowns, the figures also saw a downward trend when averaged across all industries.
This data makes a very strong argument that either employees working from home are safer, or that workplace accidents are not being reported by these employees. As we will only know the reported injuries, companies should ensure employees know that a workplace injury can still occur at home and must be reported. The safety of employees must be paramount wherever they work.
| 2020/21p* | 2019/20 | 2018/19 | 2017/18 | 2016/17 | |
|---|---|---|---|---|---|
| Non-fatal injuries per 100,000 people | 220 | 277 | 291 | 297 | 299 |
The South West experienced the most workplace deaths
In terms of workplace deaths, 2020-2021 was a troubling year. In almost all regions, numbers were higher year-on-year, despite the decrease in people working on-site from lockdowns and furlough. In fact, 2020-2021 saw the highest number of workplace fatalities in England for the last five years. The main fatal injuries to workers were classed as “multiple injuries”, “concussion and internal injuries” and “injuries not elsewhere classified” making it hard to know the root causes.
The South West had the highest amount of workplace deaths, for the first time in the last five years, with 23 fatalities recorded. This was almost double the amount of deaths in 2019/20 in the region.
This was followed by Yorkshire and the Humber, with 18 workplace deaths. Scotland saw 17 deaths, whilst Wales was the safest county, with 9 deaths recorded. The North East was the safest place with a single death recorded, the first time numbers have been this low in the last five years.
Total reported fatal injuries


Click a Marker for info
-
2016/17
-
2017/18
-
2018/19
-
2019/20
-
2020/21p*
| Area | 2020/21p* | 2019/20 | 2018/19 | 2017/18 | 2016/17 |
|---|---|---|---|---|---|
| England | 116 | 87 | 113 | 111 | 106 |
| South West | 23 | 13 | 11 | 12 | 10 |
| Yorkshire and the Humber | 18 | 5 | 16 | 13 | 14 |
| Scotland | 17 | 11 | 29 | 17 | 18 |
| North West | 16 | 14 | 10 | 16 | 11 |
| West Midlands | 15 | 13 | 20 | 14 | 13 |
| South East | 15 | 9 | 12 | 16 | 15 |
| East | 13 | 9 | 16 | 15 | 9 |
| London | 9 | 8 | 11 | 11 | 11 |
| East Midlands | 4 | 10 | 11 | 10 | 17 |
| North East | 1 | 4 | 5 | 2 | 6 |
London had the most non-fatal injuries
London had more non-fatal injuries than any other county in 2020-2021 with 5,065 in total. This represents a total of over £55million in accident at work compensation that could have been claimed, based on the average compensation for successful claims made by Express Solicitors in the last financial year. This was however a drastic 36% fall year-on-year due in part by the coronavirus lockdowns. In fact, all areas in the top 20 had lower amounts of injuries year-on-year.
West Midlands had the second highest amount of non-fatal injuries, with 2,328 recorded in the same time period. The remainder of the top 10 was primarily driven by northern regions – Manchester, West & South Yorkshire, Merseyside and Lancashire. With, Kent, Hampshire and Essex in the South rounding out the top 10, with 1,091, 937 and 926 recorded non-fatal injuries respectively.
The most frequent causes of non-fatal injuries across Great Britain were fractures, sprains and strains, contusions, and lacerations and open wounds.
Total reported non-fatal injuries
Click a Marker for info
-
2016/17
-
2017/18
-
2018/19
-
2019/20
-
2020/21p*
| Area | 2020/21p* | 2019/20 | 2018/19 | 2017/18 | 2016/17 |
|---|---|---|---|---|---|
| London | 5065 | 7968 | 8409 | 8570 | 8100 |
| West Midlands | 2328 | 2881 | 3140 | 3269 | 3336 |
| Greater Manchester | 2048 | 2742 | 3042 | 3096 | 3072 |
| West Yorkshire | 1908 | 2402 | 2529 | 2721 | 2744 |
| Merseyside | 1163 | 1539 | 1665 | 1660 | 1563 |
| South Yorkshire | 1120 | 1472 | 1599 | 1556 | 1576 |
| Kent | 1091 | 1427 | 1452 | 1378 | 1479 |
| Lancashire | 1036 | 1363 | 1387 | 1377 | 1395 |
| Hampshire | 937 | 1194 | 1175 | 1180 | 1179 |
| Essex | 926 | 1143 | 1304 | 1357 | 1319 |
| Northamptonshire | 907 | 1092 | 1017 | 1159 | 1169 |
| Tyne and Wear | 876 | 1081 | 1255 | 1281 | 1377 |
| Staffordshire | 801 | 1059 | 1014 | 1042 | 1162 |
| Lincolnshire | 783 | 1008 | 1048 | 1036 | 1063 |
| Norfolk | 766 | 942 | 926 | 1000 | 972 |
| Hertfordshire | 754 | 977 | 1004 | 1115 | 1062 |
| Suffolk | 750 | 871 | 928 | 982 | 965 |
| Leicestershire | 696 | 827 | 856 | 883 | 856 |
East Yorkshire is the least safe place to work with the most accidents per employee
Whilst London had the most accidents in total this is partly due to the size of the region. If we take a look at the number of accidents per 100,000 employees, we get a much clearer picture of the least safe places to work and the percentage chance of being injured.
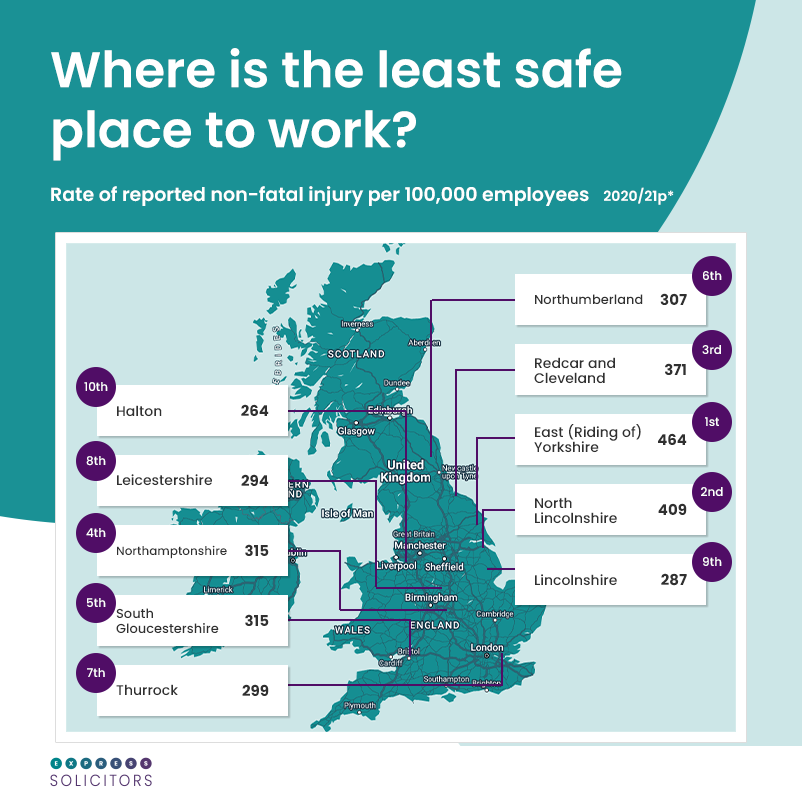
In this case, the borough East Riding of Yorkshire, also known as East Yorkshire, is the least safe county in Great Britain. With 464 accidents per 100,000 employees, you had a 0.46% chance of a non-fatal injury last year. Despite lockdowns, this was a 20% increase year-on-year. By comparison, in London you had a 0.07% chance of being injured at work.
In total, East Yorkshire saw 407 accidents across their current population of 340,000. These claims would total £4.4million in accident at work compensation based on the national average for successful claims.
Looking at the top 10, counties in the North were generally less safe than in the South, with 8 out of 10 counties on the list located in the upper half of the country. This included North Lincolnshire, Redcar and Cleveland in North Yorkshire, Northamptonshire, and Northumberland. South Gloucestershire and Thurrock in Essex were the least safe Southern counties and the only ones in the top 10.
Rate of reported non-fatal injury per 100,000 employees
| Area | 2020/21p* | 2019/20 | 2018/19 | 2017/18 | 2016/17 |
|---|---|---|---|---|---|
| East Yorkshire | 464 | 384 | 483 | 471 | 447 |
| North Lincolnshire | 409 | 388 | 481 | 417 | 409 |
| Redcar and Cleveland | 371 | 368 | 450 | 429 | 416 |
| Northamptonshire | 315 | 341 | 323 | 401 | 400 |
| South Gloucestershire | 315 | 414 | 415 | 322 | 386 |
| Northumberland | 307 | 284 | 319 | 346 | 235 |
| Thurrock | 299 | 371 | 412 | 363 | 408 |
| Leicestershire | 294 | 339 | 352 | 377 | 357 |
| Halton | 264 | 298 | 363 | 296 | 379 |
| Derbyshire | 264 | 291 | 288 | 320 | 310 |
| Suffolk | 262 | 277 | 307 | 355 | 307 |
| Cornwall and Isles of Scilly | 253 | 295 | 292 | 297 | 247 |
| County Durham | 252 | 341 | 323 | 326 | 342 |
| Nottinghamshire | 250 | 316 | 345 | 354 | 351 |
| North East Lincolnshire | 248 | 281 | 331 | 319 | 372 |
| Staffordshire | 247 | 326 | 309 | 318 | 351 |
| Warwickshire | 246 | 296 | 353 | 353 | 395 |
| Somerset | 245 | 287 | 287 | 284 | 284 |
| Stockton-on-Tees | 244 | 274 | 341 | 372 | 358 |
London is the safest place to work
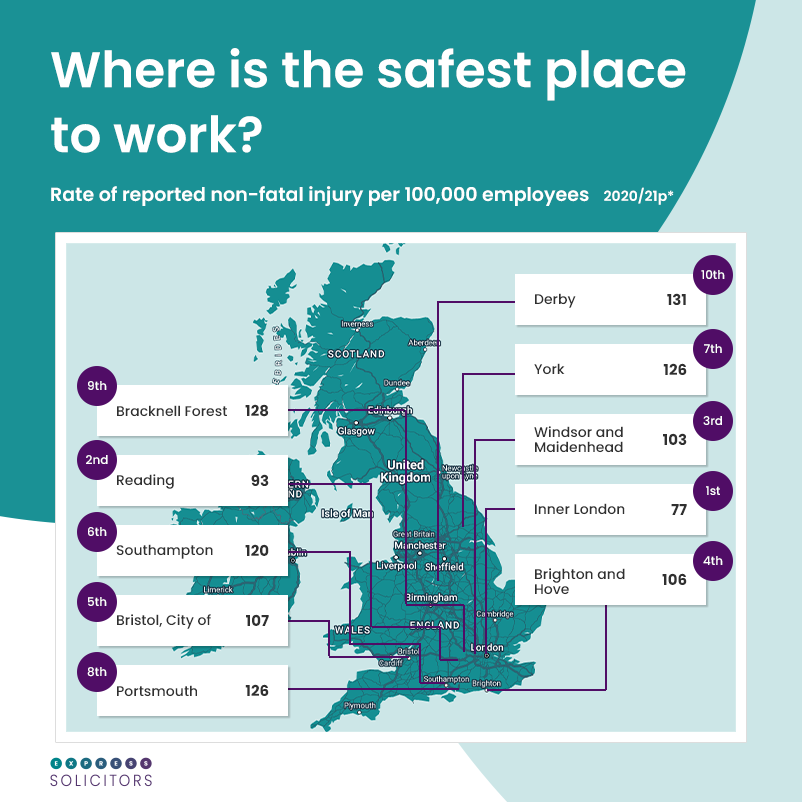
As mentioned above, whilst London had the most total non-fatal injuries this was primarily due to its extensive population. In fact, the population size is so great in the region that when averaged out across all employees, the risk of injury is lower in London than any other county. 77 employees per 100,000 had a non-fatal injury in 2020-2021, 65% lower than the average across Great Britain of 220 employees per 100,000.
If we look at the city of London district specifically, the numbers are even lower, with 10 non-fatal injuries recorded.
Reading was the second safest county, followed by Windsor and Maidenhead, Brighton and Hove, and the City of Bristol. These counties had 93, 103, 106 and 107 non-fatal injuries per 100,000 employees, all under half the national average. York is the safest county in the North, whilst Derby is the safest county in the Midlands.
The risk of danger should never be downplayed, and we must always remain vigilant of the potential for accidents, no matter where we live. So even if you live in one of the safest places to work in Great Britain, please don’t let your guard down.
Rate of reported non-fatal injury per 100,000 employees
| Area | 2020/21p* | 2019/20 | 2018/19 | 2017/18 | 2016/17 |
|---|---|---|---|---|---|
| Inner London | 77 | 136 | 149 | 150 | 139 |
| Reading | 93 | 126 | 153 | 182 | 137 |
| Windsor and Maidenhead | 103 | 168 | 196 | 191 | 153 |
| Brighton and Hove | 106 | 174 | 156 | 155 | 161 |
| Bristol | 107 | 160 | 156 | 166 | 184 |
| Southampton | 120 | 199 | 203 | 204 | 182 |
| York | 126 | 149 | 185 | 192 | 179 |
| Portsmouth | 126 | 212 | 185 | 202 | 178 |
| Bracknell Forest | 128 | 157 | 170 | 212 | 148 |
| Derby | 131 | 152 | 194 | 200 | 195 |
| Buckinghamshire | 132 | 219 | 242 | 241 | 256 |
| Bath and North East Somerset | 133 | 196 | 184 | 180 | 197 |
| Wokingham | 138 | 215 | 210 | 226 | 200 |
| Slough | 140 | 228 | 181 | 230 | 207 |
| Nottingham | 142 | 185 | 216 | 227 | 261 |
| Luton | 142 | 182 | 250 | 247 | 257 |
| Leicester | 143 | 159 | 175 | 195 | 200 |
| West Sussex | 144 | 226 | 260 | 243 | 233 |
| Torbay | 147 | 222 | 220 | 299 | 288 |
| Bournemouth, Christchurch and Poole | 156 | 189 | 233 | 212 | 227 |
Have you had an accident at work?
The above data is only based on reported accidents and sadly many people choose to suffer in silence without reporting their injuries. In addition, many are missing out on support and compensation they could receive. If you have suffered an accident, you can speak to our no win no fee solicitors today for no obligation advice on your claim.
Sources / methodology
All data is based on the “Reporting of Injuries, Diseases and Dangerous Occurrence Regulations reported Injuries by country, region, and unitary or local authority” by the Health and Safety Executive.
* 2020/21 data is based on provisional data and averages are based on our own analysis.
All content is based on our own analysis of the data and does not constitute an endorsement of our analysis by the Health and Safety Executive or any other body.